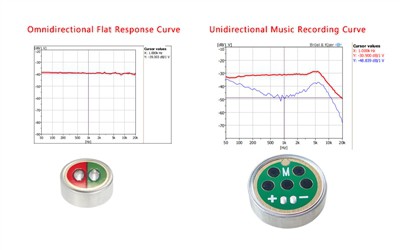
What is a Frequency Response Curve?
The frequency response curve of a microphone represents its sensitivity across various frequencies. Understanding this curve is crucial for assessing a microphone's audio performance.

Axes Explained
- X-Axis: Represents the frequency range in Hertz (Hz). Typically, this spans from 20Hz to 20kHz, covering the audible spectrum.
- Y-Axis: Indicates sensitivity or gain in decibels (dB). Higher gain values show increased sensitivity at specific frequencies.
Interpreting the Curve
The shape of the frequency response curve reveals how evenly a microphone captures sound across its range. A flat curve indicates consistent sensitivity, while variations may highlight the microphone's suitability for particular applications, such as voice recording or music.
Peaks and Valleys
Peaks in the curve indicate frequencies where the microphone is particularly sensitive, while valleys show lower sensitivity. These features are crucial for understanding the mic's performance characteristics.
Reference Line
Many frequency response charts include a reference line (typically at 0dB) for comparison. This allows for a clearer understanding of the microphone's gain across different frequencies.
Measuring Frequency Response
To obtain a frequency response curve, specialized audio testing equipment or software is used. These tools generate sound signals at various frequencies, capturing and analyzing them through the microphone to create the frequency response graph.
Conclusion
Understanding a microphone's frequency response curve is vital for selecting the appropriate mic for specific audio applications. By analyzing this curve, users can ensure optimal performance for their recording needs.


